README
Introduction
Dokdo is a lightweight Python package for microbiome sequencing analysis, which can be used as a command line tool and as a Python module. Dokdo is designed to be used with QIIME 2, a powerful community-developed platform for microbiome bioinformatics.
Dokdo is versatile like the swiss army knife. For example, you can use its command line interface (CLI) to create various input files for QIIME 2 (e.g. a manifest file or a sample-metadata file) or perform a variety of secondary analyses. You may also use Dokdo’s application programming interface (API) with Jupyter Notebook to create publication-quality figures using output files/objects from QIIME 2 (e.g. a taxonomic bar plot or an alpha rarefaction plot).
For more details, please see Read the Docs which serves as the official user documentation for Dokdo, including instructions, tutorials, and other important information. The website also documents select information and resources pertaining to QIIME 2 and general microbiome bioinformatics that I find particularly useful.
Your contributions (e.g. feature ideas, pull requests) are most welcome.
Citation
If you use Dokdo in a published analysis, please report the program version and the GitHub repository (https://github.com/sbslee/dokdo). If applicable, please also consider citing the following preprint in which Dokdo was first described:
JY Park, H Yoon, S Lee, et al. Do Different Samples From Pregnant Women and Their Neonates Share the Common Microbiome: A Prospective Cohort Study. Research Square. November 29th, 2021.
Below is an incomplete list of publications which have used Dokdo:
Hsieh et al., 2022 in Scientific Reports: Gut microbiome profiles and associated metabolic pathways in patients of adult-onset immunodeficiency with anti-interferon-gamma autoantibodies.
Reinold et al., 2022 in Frontiers in Cellular and Infection Microbiology: The Fungal Gut Microbiome Exhibits Reduced Diversity and Increased Relative Abundance of Ascomycota in Severe COVID-19 Illness and Distinct Interconnected Communities in SARS-CoV-2 Positive Patients.
Silva de Carvalho et al., 2022 in Brain, Behavior, and Immunity: Post-ischemic protein restriction induces sustained neuroprotection, neurological recovery, brain remodeling, and gut microbiota rebalancing.
Park et al., 2021 in Scientific Reports: Effect of black ginseng and silkworm supplementation on obesity, the transcriptome, and the gut microbiome of diet-induced overweight dogs.
Reinold et al., 2021 in Frontiers in Cellular and Infection Microbiology: A Pro-Inflammatory Gut Microbiome Characterizes SARS-CoV-2 Infected Patients and a Reduction in the Connectivity of an Anti-Inflammatory Bacterial Network Associates With Severe COVID-19.
Support Dokdo
If you find my work useful, please consider becoming a sponsor.
CLI Examples
To create a manifest file from a directory containing FASTQ files:
$ ls -1 fastq-dir
sample1_R1.fastq.gz
sample1_R2.fastq.gz
sample2_R1.fastq.gz
sample2_R2.fastq.gz
sample3_R1.fastq.gz
sample3_R2.fastq.gz
sample4_R1.fastq.gz
sample4_R2.fastq.gz
$ dokdo make-manifest -i fastq-dir -o manifest-file.tsv
$ cat manifest-file.tsv
sample-id     forward-absolute-filepath       reverse-absolute-filepath
sample1      /some/filepath/sample1_R1.fastq.gz  /some/filepath/sample1_R2.fastq.gz
sample2      /some/filepath/sample2_R1.fastq.gz  /some/filepath/sample2_R2.fastq.gz
sample3      /some/filepath/sample3_R1.fastq.gz  /some/filepath/sample3_R2.fastq.gz
sample4      /some/filepath/sample4_R1.fastq.gz  /some/filepath/sample4_R2.fastq.gz
To summarize a feature table:
$ dokdo summarize -i table.qza
Number of samples: 34
Number of features: 770
Total frequency: 153884.0
Frequency per sample:
0.00     898.00
0.25    1838.25
0.50    4010.50
0.75    7016.00
1.00    9820.00
Frequency per feature:
0.00        2.0
0.25        8.0
0.50       23.0
0.75       81.0
1.00    11404.0
API Examples
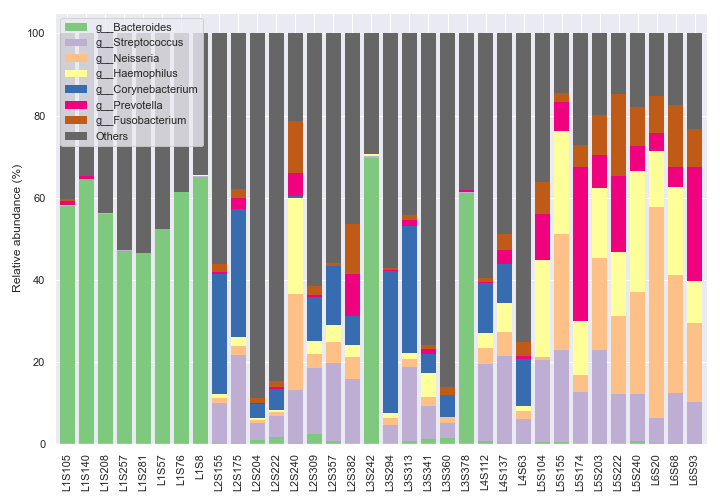
To create a taxonomic bar plot from QIIME 2’s .qzv file:
dokdo.taxa_abundance_bar_plot(
    'taxa-bar-plots.qzv',
    figsize=(10, 7),
    level=6,
    count=8,
    legend_short=True
)
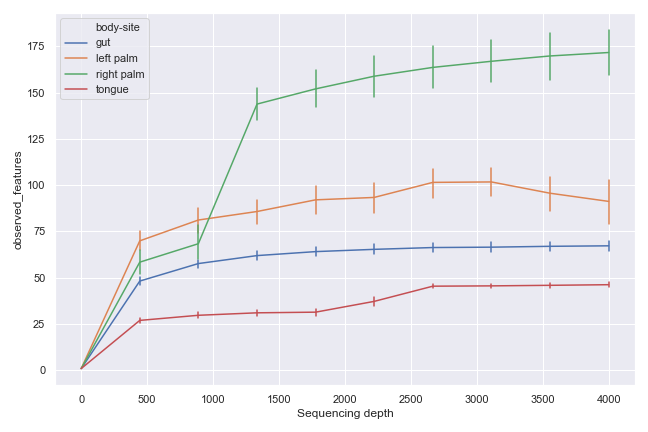
To create an alpha rarefaction plot from QIIME 2’s .qzv file:
dokdo.alpha_rarefaction_plot(
    'alpha-rarefaction.qzv',
    hue='body-site',
    metric='observed_features',
    figsize=(8, 5)
)
Getting Started
To install Dokdo, enter the following in your terminal:
$ git clone https://github.com/sbslee/dokdo
$ cd dokdo
$ pip install .
Dokdo is built with QIIME 2 API, so it must be run in an environment where QIIME 2 is already installed. For example, if you use the Anaconda distribution, activate your conda environment (e.g. qiime2-2020.8) with QIIME 2 before using Dokdo. This can be done in Terminal with the following:
$ conda activate qiime2-2020.8
Alternatively, you can use Anaconda Navigator which is the desktop graphical user interface (GUI) for Anaconda: Anaconda Navigator > Environments > qiime2-2020.8 > Open with Jupyter Notebook.
Package Purpose
QIIME 2 is one of the most well-documented and easy-to-use tools I have ever worked with. There is no doubt that QIIME 2 is superb for beginners to get started with microbiome bioinformatics. I also love the QIIME 2 community which is supportive and respectful to one another. If you haven’t visited QIIME 2 Forum yet, I strongly invite you to go there and explore the endless abyss of microbiome-analysis knowledge! You will also find me and my posts there. That being said, I wrote the Dokdo package to:
Dynamically create publication-quality figures with Jupyter Notebook using output files/instances from QIIME 2 (Dokdo API). QIIME 2 already provides high-quality, interactive figures via Visualizations (e.g. .qzv files) and QIIME 2 View. Visualizations are excellent at allowing users to interactively explore the data; however, they are not optimized for presentation (e.g. PowerPoint or publication) due to the lack of options to control various aspects of a figure (size, legend, labels, etc.). Moreover, once created, those visualizations cannot be modified, for example, to make a subset of the samples (e.g. a taxonomic bar plot). Therefore, the user would have to go way back to perform sample filtration, redo the analysis, and create a new visualization again, which can be burdensome and time-consuming. Finally, some visualizations simply do not support the user to download a given figure (e.g. an alpha rarefaction plot). With Dokdo API, the user can directly manipulate a given visualization to make necessary figures. At this point, let me be very clear: I’m not saying QIIME 2 Visualizations should be able to do all the things I mentioned above. I would say it’s actually better QIIME 2 doesn’t do those because then its code can stay simple and focused on the method’s core functionality. That’s what programs like Dokdo are for!
Create convenience or pipeline commands that combine several QIIME 2 methods (Dokdo CLI). For example, the
make-manifestcommand in Dokdo CLI automatically creates a manifest file that can be used by QIIME 2 from a directory containing FASTQ files. Another example is thesummarizecommand which extracts summary statistics from a feature table so the user does not have to create a Visualization file just to get simple statistics.